Ramachandran Plots
Introduction
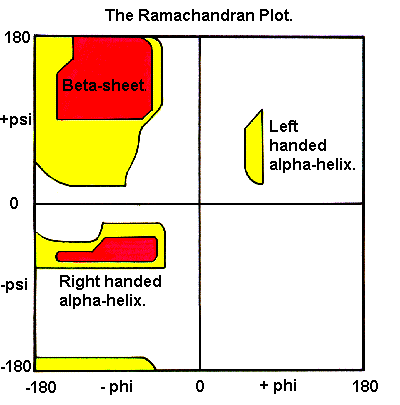
Ramachandran and Ramakrishnan plotted backbone psi angles against phi angles to generate the 'Ramachandran Plot'

Certain combinations of phi/psi angles are favoured or disallowed:
- Favoured areas of the plot correspond to the common secondary structures
- Disallowed regions result from steric hindrance
Practical work
The University of Cambridge provides a server for generating Ramachandran Plots. To start the RAMPAGE server, click here.
Click the 'Browse...' button on the RAMPAGE server and locate the beta strand peptide you created earlier. Click 'SUBMIT TO RAMPAGE'. Be patient, the server is quite slow. Observe the distribution of black squares which represent the phi/psi combinations of the amino acids.
Repeat with the alpha helix.
Observe the different favoured distributions for general amino acids, glycine, proline and 'pre-proline' (the residue appearing immediately before a proline). Given what you have seen about the location of alpha-helical and beta-strand residues on the plots, are any of these residue classes disallowed in alpha-helices or beta-strands?
If the Rampage server isn't working, we have provided a simple server for generating Ramachandran Plots. To start the server, click here.
Click the 'Browse...' button on the Ramachandran plot server and locate the beta strand peptide you created earlier. Click 'Submit'. Observe the distribution of green squares which represent the phi/psi combinations of the amino acids.
Repeat with the alpha helix.
The 'allowed' areas are as shown in the picture above and are not particularly accurate, so don't be surprised if you see phi/psi angle combinations outside these areas.
In actual fact, there are different favoured distributions for general amino acids, glycine, proline and 'pre-proline' (the residue appearing immediately before a proline).
From your knowledge of amino acids from last week, why are glycine and proline special? Will the different favoured regions for these amino acids influence their ability to adopt either the alpha-helical or beta-strand conformation?
Make sure you discuss this with a demonstrator!
Now try generating a Ramachandran plot for some real proteins. You can download:
If possible, work with a partner and do one structure each. Compare the results. Do you think the observed differences reflect real differences in the structures of differences resulting from the methods used to determine them?