Motivation
Mutations to functionally important residues in a protein could explain a disease phenotype. It is likely that residues found to be highly conserved across disparate species are likely to be conserved for a reason.Background

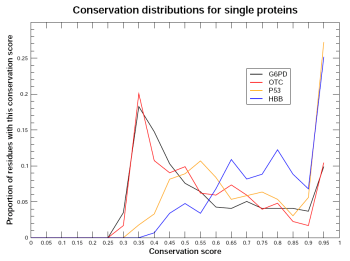
Figure 1. Varying patterns of distribution 
Conservation describes whether a residue is seen at the equivalent position, in an equivalent protein, in different species. Alignment methods identify which residues are equivalent. In this chapter, all alignments are generated using clustal. If a residue is maintained across species, it has been subject to evoluationary pressure, and therefore is likely to be critical to the protein, in terms of function, stability or fold, for example.
If a residue is conserved across a diverse set of orthologues, it is likely that the residue is critical to protein function. Mutations acting such residues could therefore disrupt protein function, potentially causing disease. Where a mutation cannot be explained using structural analyses, the functional information obtained indirectly from alignments of functionally equivalent proteins may offer an explanation.
Conservation scores are a function of genuine functional correspondence across species. However, they are also a function of the species set represented, and a function of properties of the proteins they contain.
As the species set represented by a multiple sequence alignment widens, it becomes less likely that residues will be conserved, given the evolutionary distance between the species represented in the MSA. As such, lower conservation scores will become more significant, as markers of functional relevance.
In addition, some proteins are well conserved across the sequence, perhaps because they are very ancient and/or critical, whereas others are generally not well conserved and may have evolved to be species-specific. When considering residue conservation in the context of a globally poorly conserved protein, lower conservation scores will become significant, as markers of functional relevance.
How can we accommodate these biases with a view to automatically identifying high conservation? In order to identify high conservation, we must first score conservation, and then apply a threshold. A program therefore can identify high conservation by factoring out the biases described above either when generating the conservation scores, or when applying a threshold.
Method

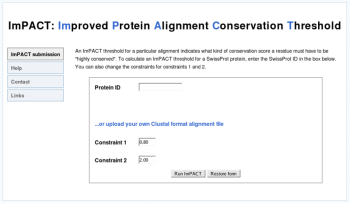
Figure 2. The web interface 
To define an alignment-specific high conservation threshold, it is necessary to appropriately characterise the distribution of conservation scores. There are many statistical methods that describe distribution data. ImPACT uses a mixture model of three Gaussians, and measurements of separation.
Mixture models allow distributions to be described using multiple Gaussian components. We make the assumption that the distribution of conservation scores is comprised of three subdistributions, G0, G1 and G2: G0 will characterise the unconserved residues, G1 will capture the distribution of moderately conserved residues, and G2 will describe the distribution of the highly conserved residues.
We are interested in making fine distinctions at the extremes of the distribution. As such, it is helpful to perform a logit transformation on the conservation data, in order to ease discrimination at the extremeties of the distribution. We must first ascertain whether the mixure model contains any significant conservation at all. If G2 exists in the middle of the distribution (e.g., logit(0.50)<mean(G2)<logit(0.70)), it may be high relative to the other residues in the protein, but it is not high enough to infer functional significance. We define an initial criteria that mean(G2)<logit(0.80).
If this criteria is met, we can then assess whether there is adequate density at the high end of the distribution that is discrete from that of the middle of the distribution. If the mean of G2 is farther than 2SD from the mean of G1, then G2 does represent high conservation, and the ImPACT threshold becomes mean(G2)+2*SD(G2).
Results for any Swissprot protein can be obtained via the web interface.